文献1(2020):The Microstructural Difference and Its Influence on the Ballistic Impact Behavior of a
Near β-Type Ti5.1Al2.5Cr0.5Fe4.5Mo1.1Sn1.8Zr2.9Zn Titanium
Alloy(近β型Ti5.1Al2.5Cr0.5Fe4.5Mo1.1Sn1.8Zr2.9Zn钛合金的微观组织差异及其对弹道冲击性能的影响。)
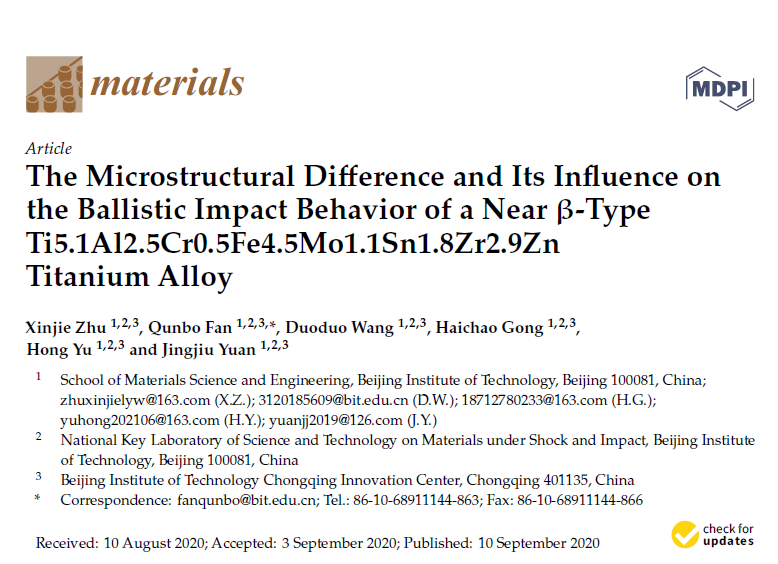
A transmission electron micrograph of prior β grains in the hot-rolled and titanium alloys is
shown in Figure 5a. It can be seen that the dislocation tangles occur in most regions of the
hot-rolled
alloy. Furthermore, these tangles, dislocation network, and dislocation cells (see regions
indicated
by arrows) form in the α/β interface and lead to a substantial increase in the dislocation
concentration. However, in contrast to the hot-rolled alloy, dislocation tangles occur in only a
few
regions in the heat-treated titanium alloy as shown in Figure 5b, indicating that the
dislocation
density decreases significantly after the treatment.
![]()
Figure 5. Transmission electron micrographs of the (a) hot-rolled specimen and
(b) heat-treated specimen.
The cracks formed in the hot-rolled and heat-treated titanium alloy plates after ballistic
testing are
quantitatively characterized via the industrial CT method as shown in Figure 10. The
three-dimensional
distributions of the main cracks in both titanium alloys as shown in Figure 10a,c reveal that
the crack
volume of the hot-rolled alloy is considerably larger than that of the heat-treated alloy (2.55
mm3 and 0.06 mm3 respectively). Magnified views of the main cracks are
shown in
Figure 10b,d. For
the
hot-rolled alloy, the maximum crack width (0.22–0.24 mm) occurs in the central region of the
bulge.
The crack width decreases gradually with the increase of the distance from the central region of
bulge,
and it varies mainly from 0.10 to 0.17 mm. However, the main crack of the heat-treated titanium
alloy undergoes incomplete propagation, and the maximum crack width (0.08 mm) occurs in several
separated points. In addition, the crack width ranges mainly from 0.03 to 0.06 mm, which is
significantly
smaller than that of the hot-rolled alloy.
![]()
Figure 10. Three-dimensional distribution of cracks, as determined via industrial
computer tomography
(CT): (a) crack distribution in the hot-rolled titanium alloy plate, (b) magnified view of the
crack in (a),
(c) crack distribution in the heat-treated titanium alloy plate, and (d) magnified view of the
crack in (c).

The failure mechanism at adiabatic shear bands of titanium alloy: High-precision survey using
precession electron diffraction and geometrically necessary dislocation density calculation
Materials Science & Engineering A 746 (2019) 322–331
[ PDF
Document Download
]
文献2(2019):The failure mechanism at adiabatic shear bands of titanium alloy: High-precision
survey using precession electron diffraction and geometrically necessary dislocation density
calculation (钛合金绝热剪切带的失效机理:采用旋进电子衍射和几何必须位错密度计算的高精度测量)
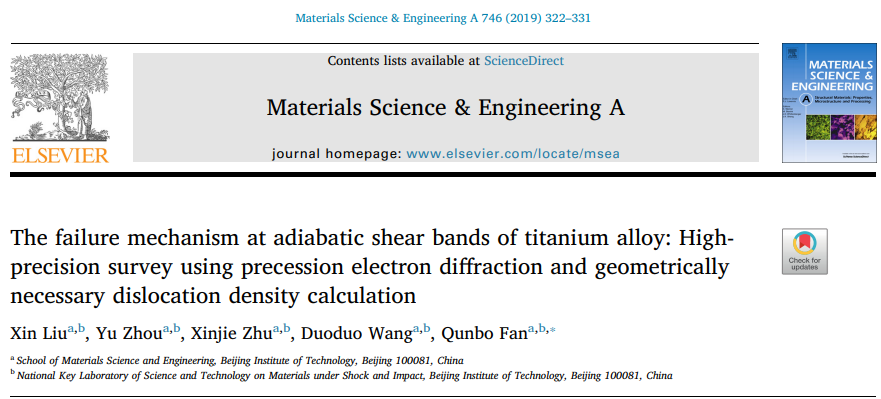
A comparison of the textures characterizing each ROI reveals no preferred crystal orientation in
the sample prior to shear localization (stage 1). Moreover, during the early stage of shear
localization (stage 2), the <0001>directions are, in general, perpendicular to the compression
direction in ASB and the surrounding region. Subsequently, when the temperature and amount
of deformation are increased, several grain orientations arise in ASB, owing to the
formation of many new grains with orientations differing from those of their respective
parents (stage 3). The number of grain orientations increases with increasing intensity of
the recrystallization (e.g., in the region near the initiation point of microcracks).
![]()
Fig.8. Schematic showing the evolution of the crystal orientations. the
morphology and corresponding GND density distribution of the α phase in ROI-1, ROI-2, and ROI-3
The distribution of dislocation cells is non-uniform and the GND density of the α phase in ASB is
relatively high, especially in the area to be fractured. In fact, the corresponding TEM
morphology near several red (i.e., high GND density) regions in ROI-2) reveal the regular
arrangement of discontinuous tiny white "voids" along the crack extension line. Compared with
that of ROI-2, the GND density associated with the group of ultrafine equiaxed recrystallized
grains is low, whereas the adjacent high GND density region consists of many substructures. The
positions of this combination of low GND density recrystallized grains and adjacent high GND
density regions is basically consistent with that of the aforementioned primary microcracks in
the main crack extension line.
The failure mechanism at adiabatic shear bands of titanium alloy: High-precision survey using
precession electron diffraction and geometrically necessary dislocation density calculation
Materials Science & Engineering A 746 (2019) 322–331
[ PDF
Document Download
]
文献3(2019):Dynamic compression-induced twins and martensite and their combined effects on the
adiabatic shear behavior in a Ti-8.5Cr-1.5Sn alloy(动态压缩诱导孪晶和马氏体及其对Ti-8.5Cr-1.5Sn合金绝热剪切行为的综合影响)
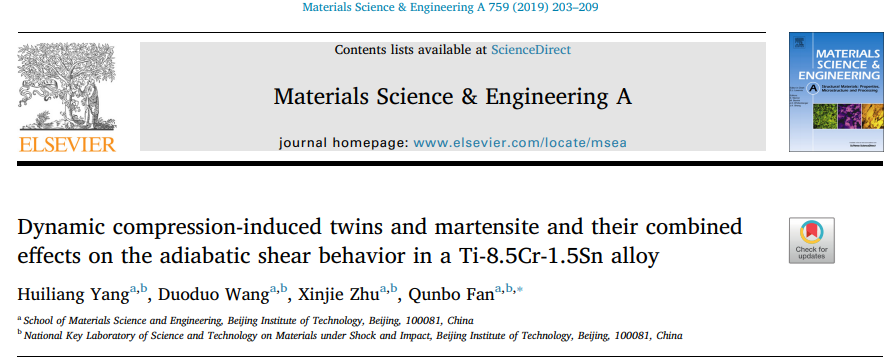
TEM observations of the alloy at strain rate of 1000/s and 1500/s after dynamic compression are
also conducted. At strain rate of 1000/s (Fig. 8(a)), the boundary of martensite and the matrix,
as well as dislocation accumulation near the boundary can be clearly seen. As strain rate
increases to 1500/s (Fig. 8(b)), martensite has lost their original shape, and become fragmented
due to severe deformation. The results showed that no ASB is observed at strain rate of 1000/s
and 1500/s, and no dynamic recrystallization occurred.
![]()
Fig.8. TEM micrographs of the alloy at different strain rates: (a)1000/s; (b)
1500/s.
Fig. 9 ① and ② show SEM images of the areas adjacent to the ASBs in the alloy, while Fig. 9 ③and
④ show regions that are relatively far from the ASBs. Many twins and a large amount of
martensite occur in the alloy, but the number of these structures is significantly lower near
the ASBs. During ASB initiation and formation, however, the twins and martensite in the vicinity
of the ASBs are refined, owing to dislocation motion and dynamic recrystallization, which will
absorb energy to some extent. Fig. 9 ① and ③ reveal the bifurcation of ASBs during the dynamic
loading process. In fact, the local stress at these locations and the structural fluctuation
increase, owing to the twins and martensite in the alloy, and ASB expansion is hindered by ASB
interaction with these locations. The expansion is also hindered by the twins and martensite
perpendicular to the shear direction, resulting in a bifurcation of the ASBs.
![]()
Fig.9. SEM images showing four typical regions of the alloy at a strain rate of
2000/s: ① and ③ show the areas adjacent to the ASBs; ② and ④ show the regions far from the ASBs.
Dynamic compression-induced twins and martensite and their combined effects on the adiabatic
shear behavior in a Ti-8.5Cr-1.5Sn alloy
Materials Science & Engineering A 759 (2019) 203–209
[ PDF
Document Download
]
文献4(2017):Microstructural characterization of an α+β type Ti-5.5Mo-7.2Al-4.5Zr-2.6Sn-2.1Cr alloy
during recrystallization annealing(再结晶退火过程中α+β型Ti-5.5Mo-7.2Al-4.5Zr-2.6Sn-2.1Cr合金的组织特征)
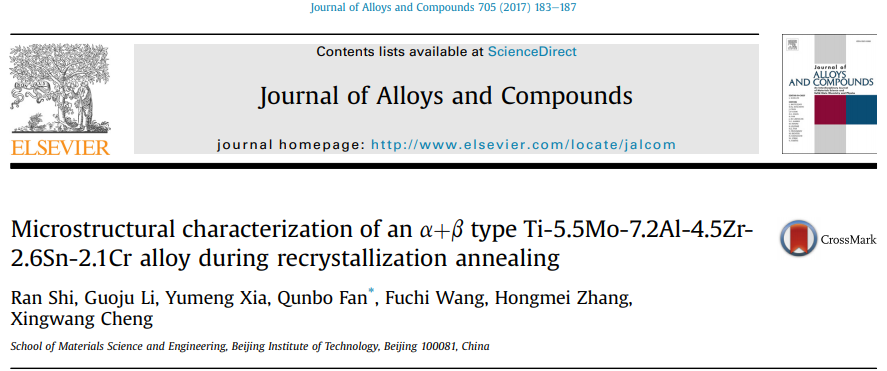
As the inverse pole figure (IPF) maps (from normal axis) show, increased holding time favors the
activation of recrystallization processes, leading to grain size refinement and the formation of
equiaxed α grains (Fig. 4(a)-(c)). With the progress of recrystallization, β grains were
sub-divided into regions by α grains exhibiting different degrees of refinement (Fig. 4(d)-(f)).
The recrystallized region has a random texture, indicating that recrystallization annealing
contributes to improved homogeneity of the grain orientation.
![]()
Fig.4. IPF maps of the a phase ((a)-(c)) and b phase ((d)-(f)) in samples
annealed at 740℃ for 1 h, 2 h, and 5 h.
A 7×7×7μm3 volume of interest was used to represent the 3D morphology of the sample.
Fig. 5(a)
shows the IPF map of the α phase and the band contrast (BC) map of the β phase; Fig. 5(b) is the
inverse of (a). The BC (Kikuchi image quality index), which reflects the degree of lattice
distortion, of the α phase is larger than that of the β phase. This indicates that the retained
strain energy of the a phase is larger than that of the β phase. The α grains shown in Fig. 5(c)
and (d) have mean misorientations of 11.05° and 7.68°, respectively, whereas the β matrix grain
(Fig. 5(e)) has a mean misorientation of 4.58°. The schematic hexagons and cubes, which showed
the mean crystallographic orientation of these grains, were superimposed on the maps. The 3D
observations revealed that large α grains were further refined to globular and equiaxed
sub-grains during recrystallization annealing and the β grains were divided into sub-regions
(i.e., large matrix grains with small misorientation). This suggests that the spatial
microstructure is composed of a highly globular, homogeneous, and equiaxed α phase dispersed in
a sub-structured β matrix.
![]()
Fig.5. (a) IPF map of the a phase and BC map of the b phase; (b) IPF map of the
b phase and BC map of the a phase; 3D microstructure of (c) and (d) a grains; (e) a b matrix
grain.
Microstructural characterization of an α+β type Ti-5.5Mo-7.2Al-4.5Zr-2.6Sn-2.1Cr alloy during
recrystallization annealing
Journal of Alloys and Compounds 705 (2017) 183-187
[ PDF
Document Download
]
文献5(2012): 微观组织对Ti-6Al-4V-4Zr-1.5Mo 合金绝热剪切敏感性的影响(Effects of Microstructure on the Adiabatic
Shear Banding Sensitivity of Ti-6Al-4V-4Zr-1.5Mo Alloy)
钛合金经过3种热处理后的1#、2#和3#显微组织如图3所示。其中图3a为低温退火后形成的1#等轴组织,其晶粒尺寸大约为10um,晶粒较细,a相分布较均匀;图3b为双重退火后形成的2#双态组织,即在网篮基体上分布着等轴状初生a相;图3c为β退火后形成的3#网篮组织,B相薄片分布在浅色a相层片。
![]()
图3 3种热处理组织形貌
微观组织对Ti-6Al-4V-4Zr-1.5Mo合金绝热剪切敏感性的影响非常明显。图5为3种组织在同一应变率(2300
s-1)条件下产生的剪切带的微观形貌,从图中可以看出:通过β退火得到的是纵横交错的网篮状组织,因此剪切带在扩展的过程中需要不断改变方向冲破更多的晶界的阻碍,同时在片状组织中运动方向的改变比在球状组织中更频繁,裂纹容易分叉形成次生裂纹,这些过程的结果使裂纹的总长度增加,
需要对更多的金属体积塑性变形做功,从而具有更高的断裂韧性。
![]()
图5 同一应变率下3种组织剪切带形貌
文献6(2012):TC6 钛合金加热和冷却过程中的相转变研究(Phase Transformation in TC6 Titanium Alloy during Heating and
Cooling)
图2为随炉升温至700, 750, 800, 850, 900 ℃,并在该温度保温15
min后水冷保留的高温状态下显微组织,其中αP、αS和β分别表示初生α相、次生α相和β相。由图2a~2e可知,随着保温温度升高,β基体内次生α相的相比例逐渐降低,β相相比例逐渐升高;在两相区较低温度(850℃及以下),如图2a、2b、2c和2d所示,初生α相相比例基本不变,而在两相区较高温度900
℃时,如图2e所示,β基体内已经没有次生α相,初生α相颗粒细化,初生α相相比例显著降低;这说明在升温阶段,α相的固溶分为两个阶段,在较低温度段,β基体内次生α相优先固溶,等轴状初生α相在较高温度段才会固溶。
![]()
图2 不同保温温度水冷的显微组织
由图5 所示,次生α相析出前自900 ℃冷却至800 ℃的过程中,初生α 相的长大速度较快,相比例显著增加,图中虚线表示未析出次生α 相时初生α 相相比例的增加趋势;次生α 相析出后自750
℃冷却至650 ℃的过程中,初生α 相的长大速度降低,相比例增加速率明显降低。次生α 相的析出会抑制初生α 相的长大,这主要是因为次生α相的析出会显著降低β
基体中溶质原子的过饱和度从而降低初生α 相的长大速度,而且β 基体中析出的次生α 相会阻塞初生α 相的长大。
![]()
图5 次生α相析出对初生α相长大速度的影响
文献7(2011):Effects of electric pulse heat treatment on microstructures and dynamic deformation
behaviors of Ti6441 alloys(电脉冲热处理对Ti6441合金组织和动态变形行为的影响)
The SEM micrographs of the L0 and LP microstructures are shown in Fig. 4(a) and (b),
respectively. Fig. 4(c) and (d) are local magnified SEM micrographs of the center regions of the
prior beta grains, which show the microstructure details of alpha plates more clearly. As
presented in Fig. 4(a) and (c), in the L0 microstructure without undergoing EPH treatment,
nuclei of alpha phases form preferentially at the prior beta grain boundaries and the alpha
phases grow fast into the grain interior from the grain boundaries along certain atomic planes.
As a result, an alpha colony is developed. At the same time, nucleation occurs at the inside of
the prior beta grain and then alpha colonies with different orientation are produced.
![]()
Fig.4. SEM micrographs of the lamellar (a), (c) L0 and (b), (d) LP
microstructures, before and after EPH treatment, respectively. (c), (d) are the magnified images
of partial region within (a) and (b), respectively.
As shown in Fig. 6, although the dynamic strength retains nearly the same high level, the LP
microstructure undergoing EPH treatment performs much outstanding dynamic ductility with 29% in
the fracture strain, in contrast with the L0 microstructure having the fracture strain of 23%,
at the 3600 s-1 strain rate. This means that at the same strain rate, the LP
microstructure can
absorb much more energy due to the augment of fracture strain during the dynamic compression
deformation process, showing the increase of load bearing time in contrast with L0
microstructure. As prior beta grains, alpha colonies, alpha plates and fine acicular alpha
precipitates are refined, the significant increase of alpha/beta phase interfaces in LP lamellar
microstructures has an advantageous effect on avoiding the stress concentration at the boundary
of alpha/beta phase, because each alpha/beta interface is assigned to less stress. Hence, the LP
microstructure can bear much longer time before fracture failure than the L0 one at the strain
rate of 3600 s-1, showing the better dynamic ductility.
![]()
Fig.6. Stress–strain curves obtained from the dynamic compression test and SEM
fractography of the dynamically fractured specimens for the (a) L0 and (b) LP microstructures,
respectively.
Effects of electric pulse heat treatment on microstructures and dynamic deformation
behaviors of Ti6441 alloys
Materials Science and Engineering A 530 (2011) 161–167
[ PDF
Document Download
]
文献8(2010):锻造工艺对 Ti-6Al-4V-4Zr-Mo 合金绝热剪切敏感性的影响(Effects of Forging Processing on Adiabatic
Shearing Sensitivity of Ti-6Al-4V-4Zr-Mo Alloy)
钛合金经过α+β 锻造与β 锻造后的显微组织如图3 所示。从图3a 中可以看出,α+β 锻造得到了等轴状组织,为均匀分布的混合组织,其中有初生α 相和(α+β)混合体,晶粒尺寸为5 μm
左右。形成这种组织的主要原因是:在α+β 锻造过程中同时发生α 与β 晶粒形状的变化,β 晶粒被压扁,并沿着金属流动的方向被拉长、破碎,在一定温度与变形程度下开始发生再结晶现象,再结晶后的α
晶粒呈现扁球状,而一些未能完全进行再结晶的α 晶粒呈纤维状或杆状。从图3b 中可以看出,β 锻造得到的显微组织为网篮状组织,其晶粒尺寸较大,并有部分原始β
晶界残留,晶界不完整、不清晰。这是由于β
锻造的温度高于该合金的相变点,因此最后形成的显微组织为网篮组织。由于变形温度较高,导致了晶粒不断长大。另外,已被打碎的晶粒有重结晶现象发生,因此最终形成晶粒尺寸较大、组织不均匀的网篮状微观组织。
![]()
图3 不同锻造工艺处理后的微观组织
图4 分别为2种试样在应变率为1800,2250,2750s-1时动态剪切的时间-电压曲线。从图4a 可看出,在应变率1800 s-1条件下2
种试样均承受了80μs
而未出现应力塌陷,即二者均未发生绝热剪切破坏;当应变率升高到2250 s-1 时,如图4b 所示,β锻造后的试样的承载时间为57.6μs,即在57.6μs
时出现了应力塌陷,发生了剪切破坏,而α+β锻造后的试样仍能完整承载80μs,即没有剪切现象出现;如图4c 所示,当应变率达到2750 s-1时,2
种试样均出现了应力塌陷,但α+β锻造后的试样承载时间较β锻长。
![]()
图 4 2种试样在同一应变率下动态剪切的电压-时间曲线